

Before you train on someone else’s dataset
Most computer vision projects start from a dataset someone else built: a public release, a vendor delivery, the work of an earlier team. Before it goes into training or becomes a benchmark, you need to know what is in it. Are the images usable? Are there copies that leak between splits? Do the boxes sit on the objects? Do the class names mean what they say?
Nobody hands you the true answer to compare with, and a dataset can be wrong in many ways at once. Checking it by hand means a dozen tools and a week of scrolling.
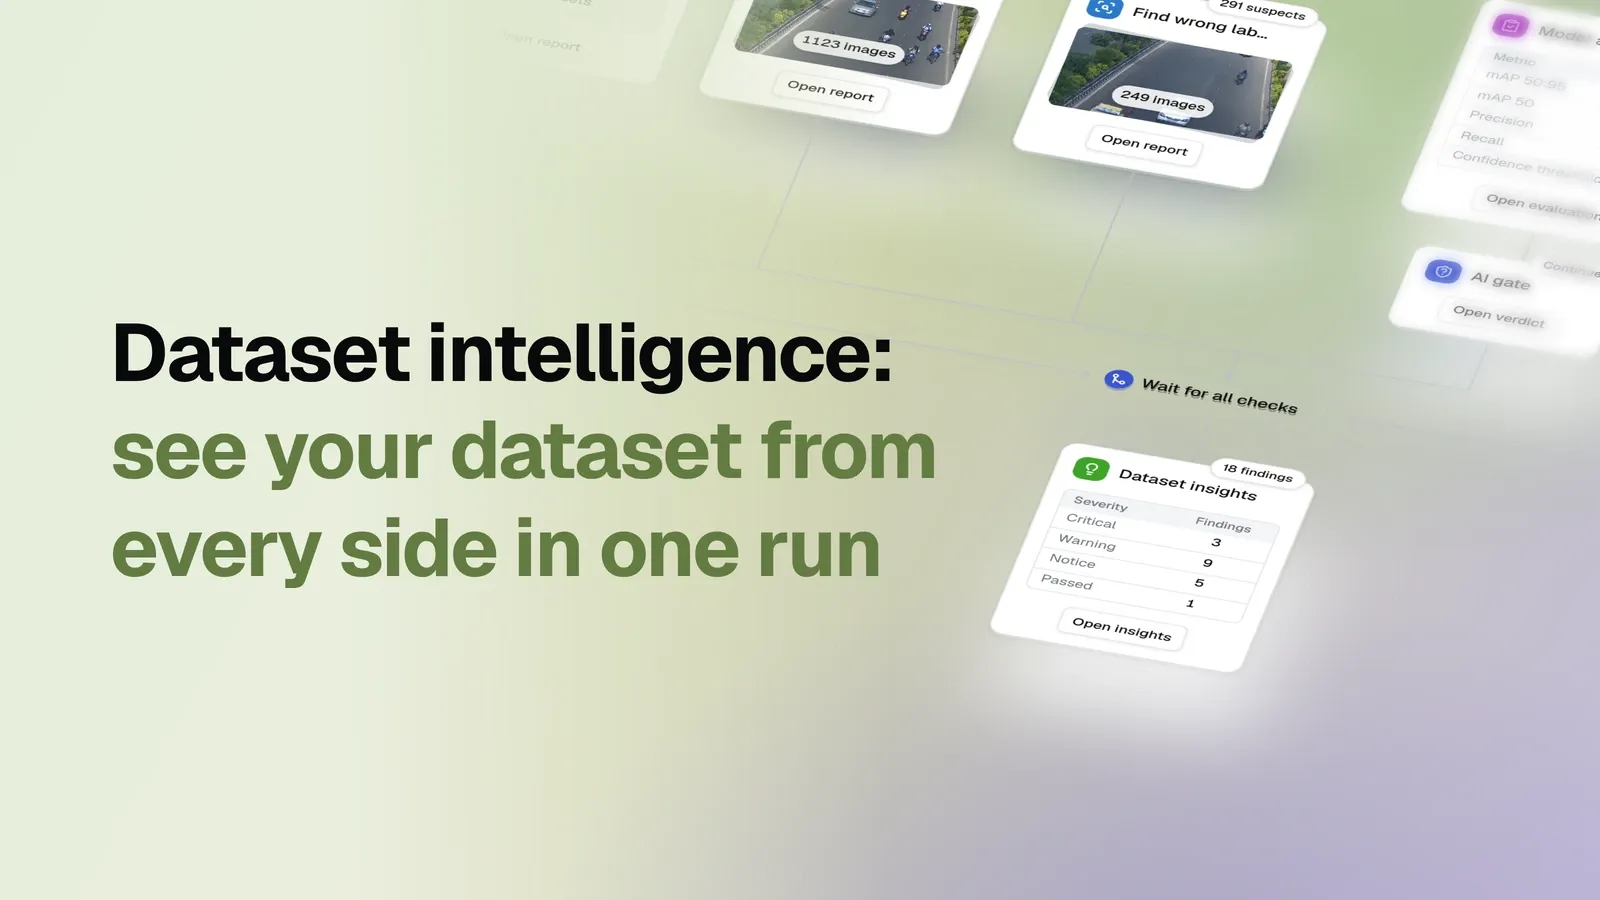
The OvalBee Dataset intelligence template does the whole audit in one run. It is a graph built from library blocks: statistics and quality checks, embedding-based searches for duplicates, anomalies and wrong labels, a zero-shot detector that acts as a second opinion on the labels, an AI gate that answers questions in plain words, and a summary report that reads every check and ranks what to fix first. The Setup wizard asks for two things: the dataset and the detector.
This post walks through one real run on IITM-HeTra, a public traffic dataset. Each section shows what a check finds in any dataset, and what it found in this one.
About the dataset copy we used. To show what the audit can do, we ran it on the Dataset Ninja copy of IITM-HeTra, where the original classes were renamed and merged: two-wheelers became
person, heavy motor vehicles becamebus, and cars and autorickshaws were merged intocar. The run got only the images and the labels, with no hint about the rename. It still found where the class list stopped matching the objects: goods trucks sitting inbusandcar. It traced the class disagreements to that cause and proposed an explicit fix: add a truck class, or write a rule for trucks and apply it to every truck. Renamed and merged classes are common when datasets move between platforms and formats, and a class list alone never shows them.
How the audit works
The checks run side by side on the same dataset, and each one writes its own detailed report. They look at the data from four sides:
- Statistics and qualityImages and boxesClass balance, sizes, blur, exposure, duplicate labels and copied files
- EmbeddingsWhat things look likeNear-duplicates, anomalies, a dataset map and objects that look like another class
- Second opinionZero-shot detectorA detector that never saw the labels is scored against them, box by box
- VerdictFix firstAn AI gate answers your question; the summary report ranks every finding
The second opinion is the key to label quality. Where the detector agrees with the labels, there is nothing to discuss. Where it disagrees, the shape of the disagreement says who is wrong. Model mistakes scatter in every direction. A disagreement that points the same way on almost every box has one cause, and that cause sits in the labels.
IITM-HeTra at a glance
| Dataset | IITM-HeTra: frames from traffic cameras, heterogeneous Indian road traffic |
| Authors | Deepak Mittal, Avinash Reddy, Gitakrishnan Ramadurai, Kaushik Mitra, Balaraman Ravindran (IIT Madras), 2018 |
| Paper | Training a deep learning architecture for vehicle detection using limited heterogeneous traffic data, COMSNETS 2018 |
| Copy audited | Dataset Ninja, GNU GPL 2.0, with renamed and merged classes |
| Images | 1,418, all 640 x 482 |
| Boxes | 6,360 in 3 classes: person 3,335, car 2,746, bus 279 |
| Splits | trainval 1,202 images, test 216 |
| Verdict | Not ready to be ground truth: person and car boxes sit low and oversized, trucks have no class |
This audit covers the Dataset Ninja copy, not the original release. Dataset Ninja renamed and merged the original classes: two-wheelers became
person, heavy motor vehicles becamebus, and cars and autorickshaws were merged intocar. The paper and the original Kaggle release use the original names. The verdict and every finding in this post describe the Dataset Ninja copy.
The traffic is heterogeneous: many vehicle types share the road and do not keep to lanes, and vehicles often hide each other. That makes it a demanding dataset to label well.
What the audit checks
| Check | What it finds in any dataset | What it found in IITM-HeTra |
|---|---|---|
| Dataset statistics | Class balance, boxes per image, object sizes, class mix per split, where objects sit in the frame | bus is 4.4% of boxes; test holds only 50 bus boxes |
| Image quality | Broken or blank files, blurry images, dark, clipped and unusually lit frames, mixed resolutions | No broken files; 21 far blurrier than the rest; 71 lit unlike the rest |
| Annotation quality | Duplicate labels, byte-identical images, empty images, tiny and oversized boxes | 15 images label one object twice; 3 byte-identical copies |
| Near-duplicate search | Exact copies, near-identical and similar images, duplicate groups, split leakage risk | 1,139 of 1,418 images have a near-identical look-alike |
| Embedding map | An interactive map of every image or object, grouped into clusters | 4 clusters; the smallest gathers frames full of buses and trucks |
| Anomaly search | Images that look unlike the rest | Not measured: the threshold sat above every score |
| Label diagnostics | Wrong labels, class confusion, least typical objects per class | 807 of 5,798 objects look closer to another class |
| Second opinion and evaluation | Bounding box offsets, loose boxes, wrong classes, missing labels, mAP and an error breakdown | Label boxes sit low on 1,547 of 1,599 matched person pairs |
| Class conflict search | Objects the labels and the detector put in different classes | 170 conflicts, 169 of them car labels the detector calls bus |
| Prelabeling efficiency | How much labeling work a model’s boxes would save | Minimal assist, until the offset is fixed |
| AI gate | A plain-words answer to your question about the reports, and a decision | “Not as it is”: localization is the main problem |
| Summary report | All findings merged and ranked, frames checked, a fix-first list | 18 findings, 3 Critical |
Dataset statistics and class balance
The statistics show the shape of a dataset before any judgement: how many objects each class has, how dense the frames are, how big the objects are, how the classes split between trainval and test, and where in the frame objects tend to sit. Rare classes and uneven splits show up here first.
IITM-HeTra is dense and mixed. A frame carries 4.49 boxes on average, and 1,020 of the 1,418
images hold more than one class. Same-class objects come in groups: 87.7% of person boxes and 85.9%
of car boxes share their frame with another box of their class. The weak spot is bus: 4.4% of
all boxes, and only 50 boxes in 46 test images, too few to compare models on that class reliably.
Image quality: blur, exposure and broken files
The image quality check opens every file and measures it. Broken and blank images are wrong whatever the use. Blur and exposure have no absolute scale, so the check measures them against the dataset itself: an image counts as blurred when it falls far below this dataset’s own sharpness, and as unusually lit when its brightness sits far from the level the rest of the set agrees on. That catches a changed camera setting or a lighting shift between batches.
IITM-HeTra is clean here. Every file decodes, none is blank, and no frame has blown highlights. 21 images are far blurrier than the rest, and 71 are lit unlike the rest: 53 darker and 18 brighter. These are worth a quick look, not a reason to stop. All 1,418 images share one size, so there is no resize decision to make.
Annotation quality: duplicate labels and copied images
The annotation quality check reads every box. It finds the same object labeled twice, images stored more than once byte for byte, images with no boxes, and boxes too thin or too large to be real.
In IITM-HeTra, 15 images carry two same-class boxes on one object, and 3 images are byte-identical copies of others. Both are mechanical fixes. Everything else checked out: no empty frames, no sliver boxes, no box covering more than half of the frame.
Duplicates and near-duplicates
The near-duplicate search compares images by their CLIP embeddings, a numeric fingerprint of what an image looks like. It sorts every pair into exact duplicates, near-identical images and strongly similar ones, and joins near-identical images into groups. The question it answers is data leakage: if a group has members in both training and test, the test score measures memory, not generalization.
In IITM-HeTra, 1,139 of 1,418 images have a near-identical look-alike, in 16 groups. Only 3 are exact copies. Traffic cameras film the same road again and again, so high similarity is expected. The summary report rates it a Warning and points at what matters: keep each look-alike group in one split.
Anomalies and the embedding map
The embedding map lays the whole dataset out by visual similarity and groups it into clusters. Open it from the graph and explore: switch between images and objects, draw around a region to see the images behind it, and add a selection to a dataset. It shows the main scenes at a glance and makes a small cluster that does not belong easy to spot.
The IITM-HeTra map groups the 1,418 images into 4 clusters. Selecting the smallest one opens 87 frames where buses and goods trucks fill much of the road: the same large vehicles the class checks below come back to.
The anomaly search scores how unlike the rest each image looks and flags those above a threshold. On IITM-HeTra it used a threshold of 0.25, and every image scored below it, so nothing could be flagged. The summary report does not call that a clean result. It files the check under “not measured” and suggests a threshold taken from the score distribution. An empty list is never presented as proof that nothing is there.
Wrong labels and class confusion
Label diagnostics compares objects, not images. Each box is cut out and embedded, each class gets an average fingerprint, and every object is checked against its own class and the others. An object that sits closer to another class may be mislabeled, or two classes may be one visual thing under two names. The least typical objects of each class form a review list.
In IITM-HeTra, 807 of 5,798 analyzed objects sit closer to another class than to their own. The
strongest direction is car toward bus: 382 car objects, 14.2% of the class.
Two more checks point the same way. The detector names a different class than the label on 258
boxes, and the class conflict search finds 170 conflicts, 169 of them car labels the detector
calls bus. The summary report opened the frames and found the cause: goods trucks labeled bus
or car, although neither fits them. That is the effect of the rename described at the top: in
the original release, bus was heavy motor vehicles, a class that holds trucks as well as buses.
Relabeling these boxes one by one into whatever the detector predicted would only move the problem. The report proposes the fix at the level of the class list: add a truck class, or write a rule for which class trucks belong to, and apply it to every truck.
A detector as a second opinion
The template auto-labels the whole dataset with Grounding DINO, a zero-shot detector prompted with the dataset’s own class names. It has never seen the labels. The evaluation then scores its boxes against the labels: mAP, AP at loose and strict overlap, precision and recall, an error breakdown that says what each kind of mistake costs, and findings about boxes that disagree in a consistent way.
Scored against the IITM-HeTra labels, the detector looks weak:
These low scores do not mean a weak detector. Person, car and bus are everyday classes, and on the frames the detector’s boxes fit the objects well. The scores measure how far the dataset’s labels sit from those boxes. The rest of this section shows where the gap comes from.
On specialised data, read low scores differently. A zero-shot detector knows the objects of everyday images. On a domain-specific dataset, such as circuit board components or cell types, it may not find the classes at all, and low scores then describe the detector, not the labels. For such data, pick a detector fine-tuned on the domain in the Setup wizard.
The shape matters more than the level. At loose overlap, car and bus score reasonably. At strict overlap, everything collapses. The detector finds the objects, but its boxes and the label boxes do not line up. The error breakdown puts a number on it: fixing box position alone would raise AP50 from 0.413 to 0.678, more than any other error type.
Bounding box offset in the labels
The evaluation compares the centre of each label box with the centre of the detector’s box on the same object. In IITM-HeTra the difference points the same way almost every time:
- Person: the label box sits 25% of its height below the detector’s box on 1,547 of 1,599 matched pairs.
- Car: the label box sits 13% of its height lower on 1,857 of 2,030 matched pairs.
Only 209 of the 2,428 pairs matched at IoU 0.5 also reach IoU 0.8. A shift this consistent does not come from careless drawing. It behaves like one offset added when the labels were converted or imported, or like a labeling rule the detector does not share. The summary report checked random and flagged frames and confirmed it: car and person boxes are shifted down and drawn too large. One correction may repair every car and person box at once.
This changes how other numbers read. 1,256 confident predictions overlap their label box only loosely, and 2,144 label boxes have no confident prediction nearby; much of both is the shifted boxes seen as overlap. Person’s near-zero AP reflects the person labels, not the detector’s ability to see two-wheelers, so no model should be compared on person until the offset is fixed.
Missing labels at the frame edge and in clumps
A confident detection where the labels have no object is a candidate missing label. The evaluation lists them, and the summary report checks frames to see what they have in common.
The detector made 839 confident predictions where IITM-HeTra has no box. The frames show the pattern: vehicles and people cut by the frame edge, or packed into tight groups, are left unboxed consistently. A model trained on these labels learns to ignore exactly those objects, and every correct detection of them counts as a false positive.
Prelabeling efficiency
The same detector boxes double as prelabels. The prelabeling check sorts every object into what a labeler would do with it: keep the box, move it, change its class, delete it, or draw a missed object from scratch. The result is an assistance score with a grade.
On IITM-HeTra the grade is Minimal assist: 3% of boxes could be kept unchanged, 42% need moving, 4% need a new class, 14% are deleted and 37% are drawn from scratch. Here the grade says little about the detector. Its boxes do not line up with the objects as this dataset labels them, so they count as moved or missed, and the score cannot tell whether this prelabeling would suit your labeling work. The summary report keeps the grade apart from the dataset verdict. Score it again once the offset in the labels is fixed.
Asking the AI gate a question in plain words
The AI gate reads the reports of the run and answers a question written in plain words, then decides whether the flow continues. In this run, the question was the one the dataset owner actually had:
Check the latest evaluation report: summarise how the model performs overall. When summarising please note that my initial dataset (passed as gt) is not ground truth, so I need some evaluation whether my dataset is good enough to use it in my following experiments (maybe model predictions more accurate in localization, classification, etc.)
The gate read the evaluation report and its data files and answered: not as it is, and localization is the main problem. In its words, “in localization, the model’s boxes are probably closer to the real objects than your labels are, at least for person and car.” It recommended three steps:
- Do not use the dataset as ground truth yet.
- Check a few flagged images. If the downward shift is confirmed, correct it in one go and run the evaluation again.
- Then review the missing-label candidates and the car and bus disputes, with the detector’s boxes as prelabels to speed up the review.
The summary report
The summary report reads every report of the run and writes one final verdict on the dataset. It also gives you a to-do list: what to fix first to improve the dataset, or at least what to look at when you review it. On the way, it merges findings that describe the same problem from different checks, ranks them by severity, opens frames with both the labels and the detector’s boxes drawn to settle who is wrong, and keeps what could not be measured apart from what passed.
For IITM-HeTra it found 18 findings:
All three Critical findings are about the label boxes. The frame check confirmed three problems
with the labels: car and person boxes shifted down and drawn too large, trucks forced into bus or
car, and objects at the frame edge or in clumps left unboxed.
It also lists what checked out fine, so a clean result is stated rather than implied:
- No empty frames: every image has at least one box, in both splits.
- No sliver boxes, and no box covering more than half of the frame.
- One frame size: all images are 640 x 482.
- The class mix matches across splits.
What to fix first in IITM-HeTra
The summary report closes with an ordered list. Shortened:
- Trace the low, oversized car and person boxes to their single cause, a conversion or import offset or a labeling rule, and correct it before training.
- Write down a labeling rule for objects cut by the frame edge or packed into clumps.
- Add a truck class, or write a rule saying which class trucks belong to, and apply it to every truck.
- Delete the second box in the 15 images where one object is labeled twice.
- Keep one copy of each of the 3 byte-identical images, or keep both copies in the same split.
- Keep each group of look-alike images in one split.
Some decisions belong to the dataset owner, and the report lists them as open questions rather than answering them. Whether trucks need their own class depends on what the model is for. Whether objects cut by the frame edge should be labeled depends on whether the deployment must react to partly visible vehicles. Whether test should be drawn by look-alike group depends on whether it is meant to measure scenes the model has never seen.
Run the audit on your own dataset
Open the Dataset intelligence template. It needs two inputs: a labeled detection dataset and a Grounding DINO model, either the Swin-T checkpoint from the model zoo or your own fine-tuned version. Every check, the AI gate and the summary report are already wired. Change the AI gate’s question to the one you have about your own data.
After a fix, run the same graph again on the corrected dataset: the same reports show whether the findings are gone.