

Introduction
A quality report tells you what is wrong with a dataset. It does not change anything - fixing the data is a separate step, and this study is about that step.
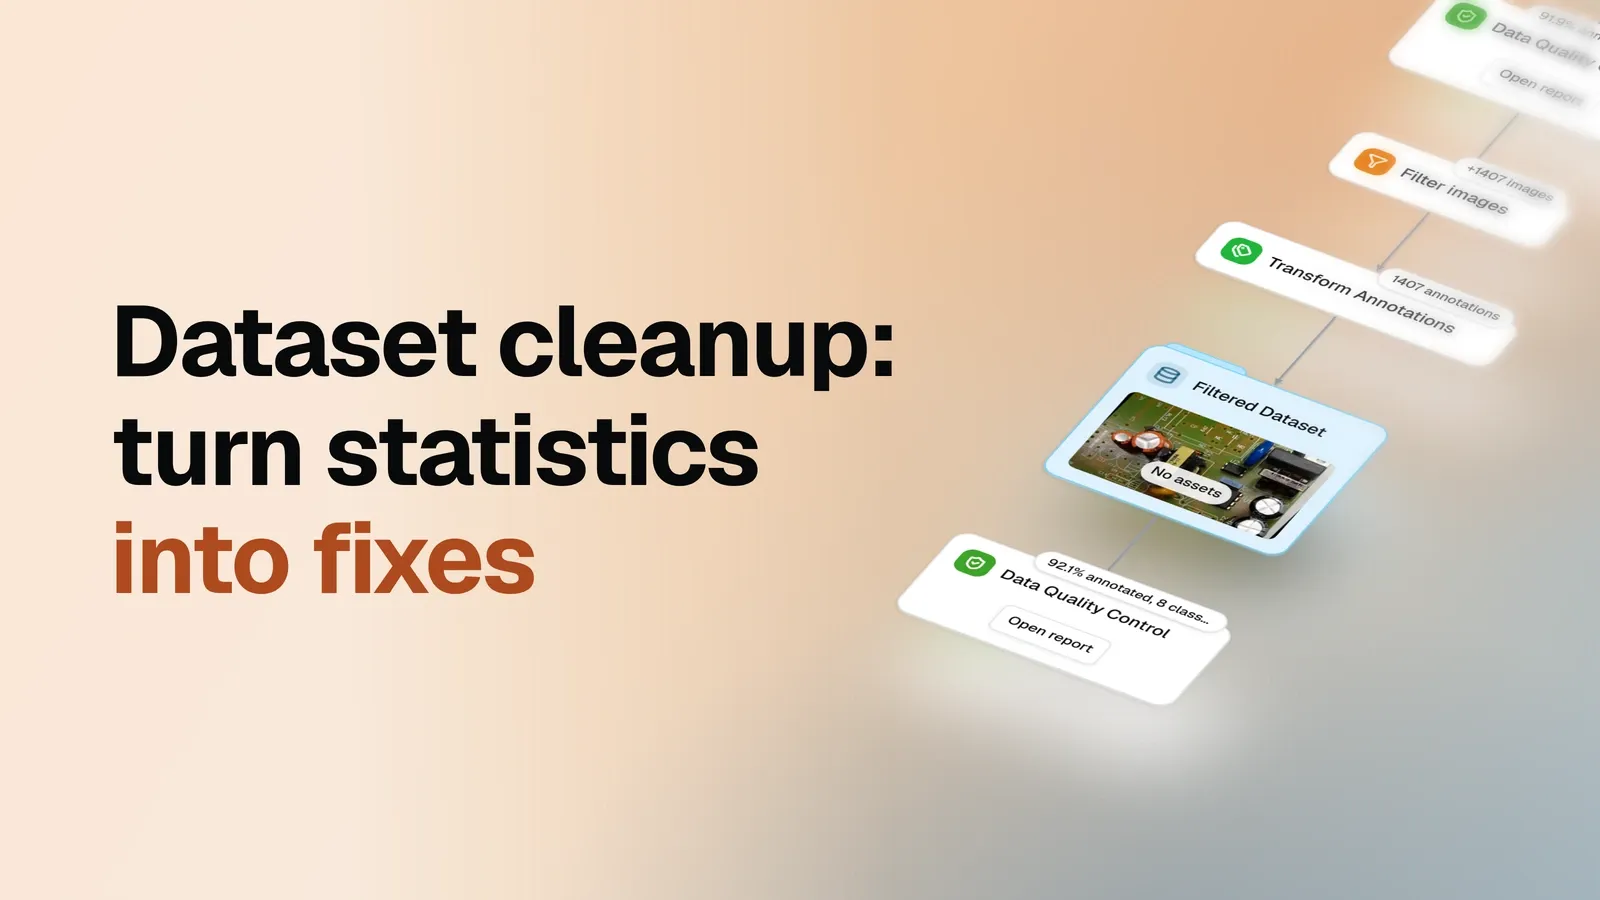
The inspection study reads a profile of PCB Component Detection chart by chart and ends with four issues, three of them about the same class. Here the same dataset goes through one graph that profiles it, fixes what the report listed, and profiles the result. The second report lists no issues at all.
Issues
The first report in this flow profiles the same dataset the inspection study used, and lists the same four issues:
| Issue | Severity | Images |
|---|---|---|
| Images with no labels | Check | 3 |
| ‘Resestor’ may be a misspelling of ‘Resistor’ | Check | 3 |
| ‘Resestor’ is rare: 0.21% of the images | Check | 3 |
| ‘Resestor’ is labeled only in val | Check | 3 |
Four rows, two actual problems. Three images in the validation split carry no labels - the 111
unlabeled images in the test split are supposed to be empty, so the report does not list them. And a
class called Resestor appears on three images: one letter away from Resistor, present on 0.21%
of the dataset, and missing from the training split. Three of the four rows describe that one class,
which is a good sign it is a typo rather than a real component.
Fixing the dataset
Two nodes, added to the graph between the two profiling steps:
- Filter images - remove the empty ones. The node matches images tagged as validation split that carry zero objects, and removes them. Three images match. The 111 empty test images do not, because the split condition separates the two cases. This node removes images, not labels: the annotations on everything it keeps are left alone.
- Transform Annotations - rename the typo class.
ResestorbecomesResistoracross the annotations of all 1407 remaining images. The three boxes stay; only the class name on them changes.
The typo class is renamed instead of deleted, because deleting it would throw away three correct boxes drawn around three real resistors. The three empty images are removed instead of sent back for labeling, because an unlabeled image inside a validation split scores every detection on it as a false positive, and three more boards add little to a split that still has 197.
Both of those are our decisions, not the report’s. The report lists what looks wrong; a person decides what to do about it.
Verifying the fix
The fixed copy goes through the same profiling node, and the two reports sit side by side:
| Before | After | |
|---|---|---|
| Images | 1410 | 1407 |
| Objects | 11119 | 11119 |
| Classes | 9 | 8 |
| Annotated | 91.9% | 92.1% |
| Validation split | 200 | 197 |
| Issues | 4 | 0 |
Every row checks one intention. Three images are gone and all three came from the validation split -
train and test are unchanged, validation went from 200 to 197. The class list is down to eight.
Resistor grew by exactly the renamed boxes: 1151 objects to 1154, on 1145 images to 1148. And the
second report does not just count zero issues - the Issues section is not in it at all, because
there is nothing left to list.
One thing the fix did not touch: two very small boxes still sit in the smallest bin of the object area histogram. The report never listed them as issues, and this graph only acted on what was listed. Removing them is one more filter condition, whenever a training run needs it.
The row worth the most attention is the object count, because it did not move: 11119 on both sides. The three removed images had no labels to lose, and the rename kept its three boxes instead of deleting them, so all four issues were closed without losing a single label. That is worth checking every time, because the quick version of this cleanup - delete the suspicious class, drop the incomplete images - ends with the same empty issues list while throwing away correct work. The issue count alone does not tell you which of the two happened. The object count does.
Takeaway
Profile, fix, profile again - one graph, one run, no training and no model. The issues that came out of the first report went straight into the second step as instructions, and the same code that raised them confirmed they were gone. Doing this before training means the run starts on a dataset somebody has already checked, instead of on one you learn about from the results.